Performance optimization for Hadoop Yarn allocator critical path
#hadoop #yarn #placementConstraint
This is still in progress.
Background
Recently, I want to introduce the ARM cpu arch into our existing Hadoop Yarn cluster, that will speed up the whole job and reduce the whole cost that compared with the original x86 cpu arch.
But this is not a soft process for this, the first important point is the compatibility. In this charpter, I don't want to describe more about this but want to share that how to isolate the computing resources for the different jobs.
Now, I have found out the compatible jobs that are all spark sql's app. And for these jobs, I hope it could use the ARM + X86 cpus. For those incompatible jobs, I hope these could be scoped in the X86 cpus.
Solution
There are 2 solutions to solve the above requirements, yarn federation and yarn node attributes, but they all have their disadvantages.
Yarn federation
Yarn federation is a proxy to federate the multiple physical yarn cluster into one abstract yarn custer, that is cool but not optimal. In this stage, I haven't seen any huge company to use this design. And these are so many issues remaining in the Hadoop yarn jiras.
So, this is not used in my current company.
Yarn node attributes
Compared with the yarn node label that introduced in yarn2.6+, node attributes are simple to configured and easy-use. But this features are ready in Hadoop3.1.
Luckily, our new hadoop cluster are all based on the Hadoop3.2. Although there are lots of bugs for this feature, this is a good design and worths investing in. Some improvements and bug fixes by practise may be shared by another blog if I have free time, some have been merged into hadoop trunk branch.
And leveraging the node attribute, the job could specify the attribute to choose the nodes to place. For ARM, the above spark sql's job could be placed on the ARM or X86. Another part must be placed on the X86. These could be implemented by the placement constraint mechanism with node attributes.
Now, the problem is raised finally. The Yarn's SingleConstraintAppPlacementAllocator is not ready for the production, becuse the performance is not good enough to allocate the 500 containers/second. Let's start this allocator optimization journey.
Optimization about allocator
Slow allocation for small requests
From the initial framegraph, SingleConstraintAppPlacementAllocator's hotpoint is as follows.
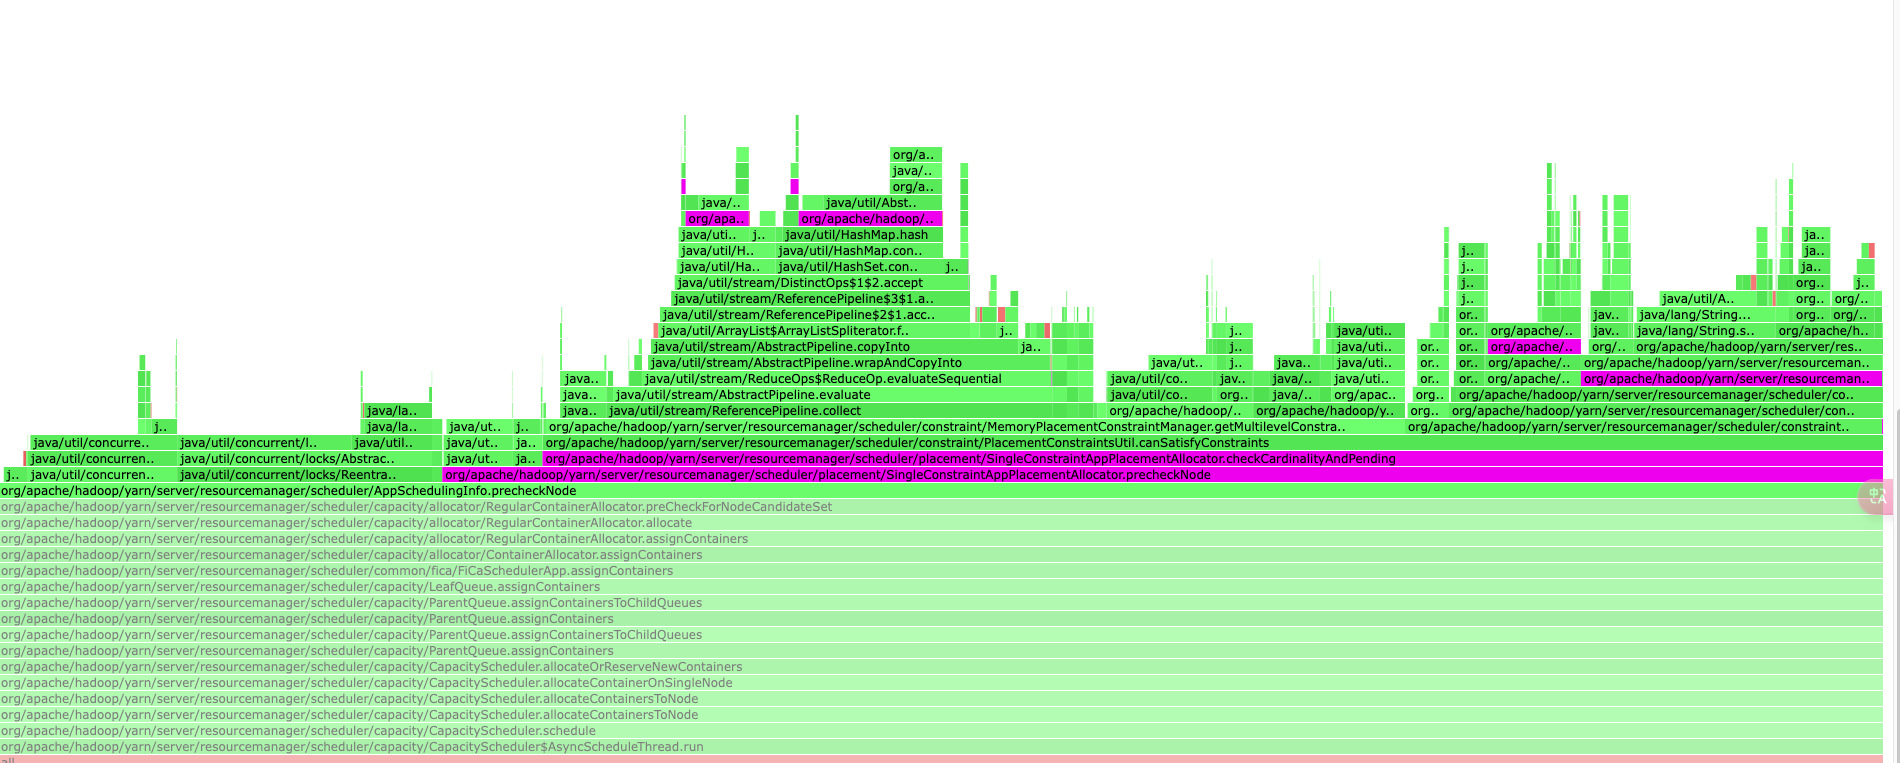
But in this stage, I just used 1000 apps(the cluster owns 10w+ apps) to specify the placement constraint. From this flamegraph, these apps slow down the whole cluster, this is crazy and strange.
Framegrph only shown the most cpu times that consumed by the underlying methods. This won't indicate the time consuming method was performing too many or time-consuming. In this stage, the time consuming was not invalid. Because we only have small part apps used this placement constraint.
After thinking several days, I think this may exist bugs that executed too many times for this checking operations.
Finally, the bug was presented by the guess and validated by the Arthas (One tool to hack into the internal JVM to show the internal state). And the concrete bug fix could be found in the https://github.com/apache/hadoop/pull/6623.
This bug was caused by the remaining requests that don't clear out when this request has been satisfied.
Slow allocation for many requests
After fixing the above bug, I applying the placement constraint into streaming jobs and all application masters. This happens on the 6 months ago.
Becuase I want to make some important containers on the stable nodes, especially after introducing some spot instances into the Yarn cluster, more details could be found on the iQIYI Big Data Hybrid OnPremise and Cloud Deployment. Although in this reference, we use the node label to implement this, but now the node attribute is a better chioce, so I did this optimization.
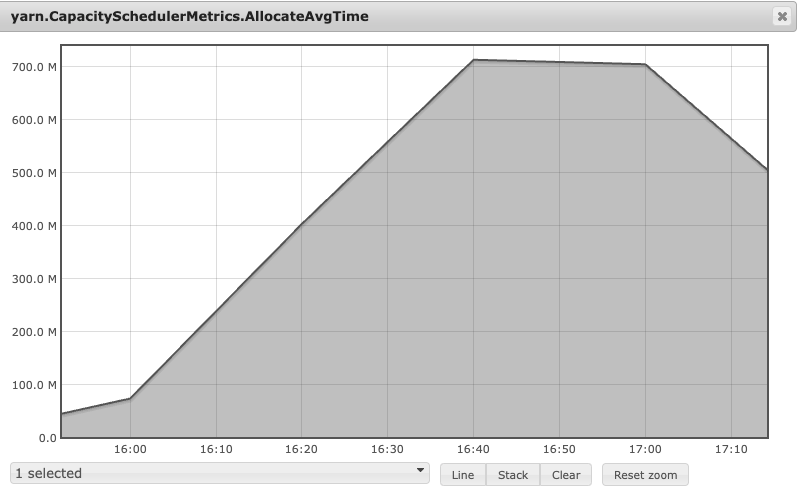
And I found some performance drop compared with the previous metrics, this could be shown in the capacityScheduler's allocationTime. Previously, the average allocation time is 2ms. But now is 10ms. Luckily, performance don't deteriorat to a level that was unacceptable to us. For us, 200ms is the threshold to make scheduler stable and quick.
But this performance regression is just triggered on the 1% container requests. If applying to 100% container requests by placement constraint, this is unacceptable. For the initial tries on the production cluster, the metrics have proved this.
And the apps were all pending in this time. From the flamegraph and jstack, all threads were all doing the SingleConstraintAppPlacementAllocator#checkCardinalityAndPending's PlacementConstraintsUtil.canSatisfyConstraints. Digging into this code, the recursion and string append were scattered everywhere, that made the performance regression.
But how to optimize this underlying matching logic about the node -> container request?
- Placement constraint is complex that composed by the multiple levels, and has multiple semantic expression that supports nested expression.
- Container request's placement constraint type number is limited, becuase app and jobs are transient that will be placed by the job submission platform.
Based on the above conditions, I think we could use the cache to optimize this rather than optmizing the underlying matching logic.