Resource Leak Of Spark Yarn Allocator
The related Spark jira ticket is https://issues.apache.org/jira/browse/SPARK-49783
Background
The motivation of this problem has a long story. Simply to say that when collecting the resource usage metrics, we found the vcore * seconds metrics from yarn side are not correct, that are always greater than the result from the spark event logs. (This is found by mentor chengBing).
Fortunately, I have some experience in extending Spark yarn allocator to support yarn placement constraint on Spark. And so, I suspect the resource leak happens on the spark yarn allocator after looking for some logs in the spark driver.
Under the hood of allocation
Spark Driver's ApplicationMaster is the core to manager(including request/release) resources and start requested containers from the Hadoop Yarn.
For the normal case that scoped in the non dynamic allocation, the request and release is easy, only when all the resources requests are satisfied, the job will start the its internal task scheduling.
But after the dynamic allocation is enabled, the spark's applicationMaster will have to take more responsibility. And let's look at this part in more details.
Spark ApplicationMaster
The whole spark's application master design don't obey the formal Yarn recommendation way to implement, that don't extend the yarn client's resourcemanager callback class.
It will start the background thread to call yarnAllocator's allocateResource.
YarnAllocator's allocateResource Review
- Update the resource request in the method of
YarnAllocator.updateResourceRequests- Check the rack/node locality request, if these requests have been satisfied, that will be released by invoking the
AMRMClient.removeContainerRequest - Check the latest target resource requirement, if the real requirement is small than the requested, the diff container will be removed by the
AMRMClient.removeContainerRequest. Otherwise, the newer container request will be added into the request list byAMRMClient.addContainerRequest
- Check the rack/node locality request, if these requests have been satisfied, that will be released by invoking the
- Gotten the allocated resource from the Yarn resourceManager that invokes the
val allocateResponse = amClient.allocate(progressIndicator)to get the allocated resource- Found the decommissioning nodemanagers, the containers located on this nodemanager will be graceful decommissioned by spark side, like the incremental tasks will not be scheduled to that executor, or migrate partial data into another executors, and so on.
- Found the completed containers, and then to check the executor's exit status.
- Found the allocated containers,
- find out the best match locality containers and then release those over-allocated containers.
- if the latest target requirement > requests, it will start these allocated containers.
- if the latest target requirement < requests, spark will skip these allocated containers.
The problem happens on the logic of if the latest target requirement < requests, spark will skip these allocated containers. If these assigned containers are skipped/ignored by the spark side, it should be released. Otherwise, the container will be reserved by ResourceManager at least 10min(This is the default timeout, which is determinzed by the Hadoop Yarn's yarn.resourcemanager.rm.container-allocation.expiry-interval-ms) .
Why this will happen?
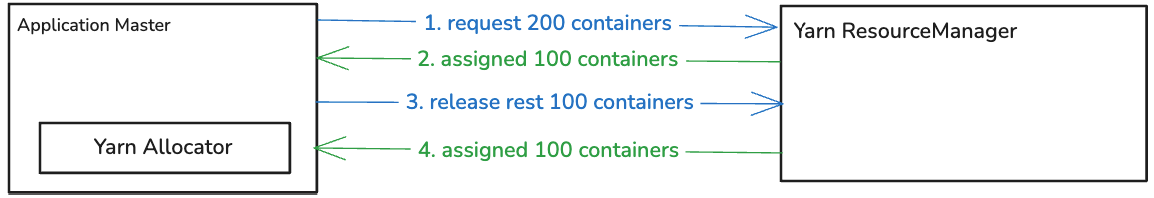
When the dynamic allocation is enabled, the resource update happens so often. From the above picture, the step3 will release the unused 100 containers, but pity, these 100 containers has been assigned in the resourceManager side. So the step4 will still happen, this is the key point of this problem.
Obviously, these 100 container request will be skipped by spark driver, but not released explicitly.
What are the consequences?
- It will effect the vcore * seconds statistics, because this bug breaks down the real resource usage. Normally, the vcore * seconds result from Yarn side will be greater than the result gotten from the spark's eventlog in the spark side.
- Lots of reserved expired/unreleased containers waste the cluster resource with a high ratio. From our internal cluster statistics, the waste ratio of cluster resource is 25% if spark type's jobs are exclusive in this cluster. This is really amazing.
How to fix
Fix is simple and easy, I think one line is enough. Please see the concrete spark PR. Link
Verification
After applying this fix, verification is important. So I use the specified internal SQL to re-produce this bug. These are 2 ways to verfiy this effectiveness quickly.
- Compare the vcore * seconds metrics from the yarn and spark side, if the diff is little, this is effective.
- Check the container release time, if the interval of assigned and release is little, this is effective.
In the long term, the cluster's all spark jobs vcore * seconds metrics from spark or yarn side should be equal, but this requires you to have a complete metrics system. I haven't this metrics curve, I will attach this for the next days.
In this case, I submitted the same spark job with and w/o this patch.
vcore * seconds result
| bug fixed patch | [yarn] vcore * seconds | [spark] vcore * seconds |
|---|---|---|
| without | 527443 | 366083 |
| with | 387128 | 382185 |
container released interval time
before this patch
the log in spark driver side
24/09/25 14:04:48 INFO YarnAllocator: Allocated containers: 35. Current executor count: 501. Launching executor count: 0. Cluster resources: <memory:1, vCores:1>.
24/09/25 14:04:48 INFO YarnAllocator: Launching container container_e35_1722241966349_12692579_01_000504 on host hostxxxxx for executor with ID 502 for ResourceProfile Id 0
24/09/25 14:04:48 INFO YarnAllocator: Skip launching executorRunnable as running executors count: 501 reached target executors count: 500.
the log in nodemanager hostxxxxx side of container_e35_1722241966349_12692579_01_000504
2024-09-25 14:17:22,788 WARN org.apache.hadoop.yarn.server.nodemanager.containermanager.ContainerManagerImpl: couldn't find container container_e35_1722241966349_12692579_01_000504 while processing FINISH_CONTAINERS event
The released interval time is 13 min.
after this patch
the log in spark driver side
24/09/25 14:29:36 INFO YarnSchedulingRequestAllocator: Launching container container_e35_1722241966349_12697320_01_000522 on host hostxxxx for executor with ID 520 for ResourceProfile Id 0
24/09/25 14:29:36 INFO YarnSchedulingRequestAllocator: Skip launching executorRunnable as running executors count: 517 reached target executors count: 500.
the log in nodemanager hostxxxxx side of container_e35_1722241966349_12697320_01_000522
2024-09-25 14:29:40,874 WARN org.apache.hadoop.yarn.server.nodemanager.containermanager.ContainerManagerImpl: couldn't find container container_e35_1722241966349_12697320_01_000522 while processing FINISH_CONTAINERS event
The released interval time is 4 seconds.
This confirm it looks effective.